Google has released PaperBanana, a research tool that automates one of academia's most tedious tasks: creating publication-ready diagrams from methodology descriptions. The system uses a five-agent creative pipeline to analyze text, retrieve visual patterns from top conference papers, and generate refined diagrams that human evaluators preferred over manual designs in nearly 75% of cases.
Key Takeaways
- Google released PaperBanana, an AI system that transforms raw methodology text into publication-ready academic diagrams using a 5-agent creative pipeline.
- In blind evaluations, humans preferred its outputs nearly 3 out of 4 times over manually designed figures.
What PaperBanana Does

PaperBanana transforms raw methodology text—the dense paragraphs describing experimental setups, architectures, or workflows—into polished academic figures suitable for venues like NeurIPS, ICML, or CVPR. The tool's most notable feature is that it was used to create the diagrams in its own research paper, demonstrating self-referential capability.
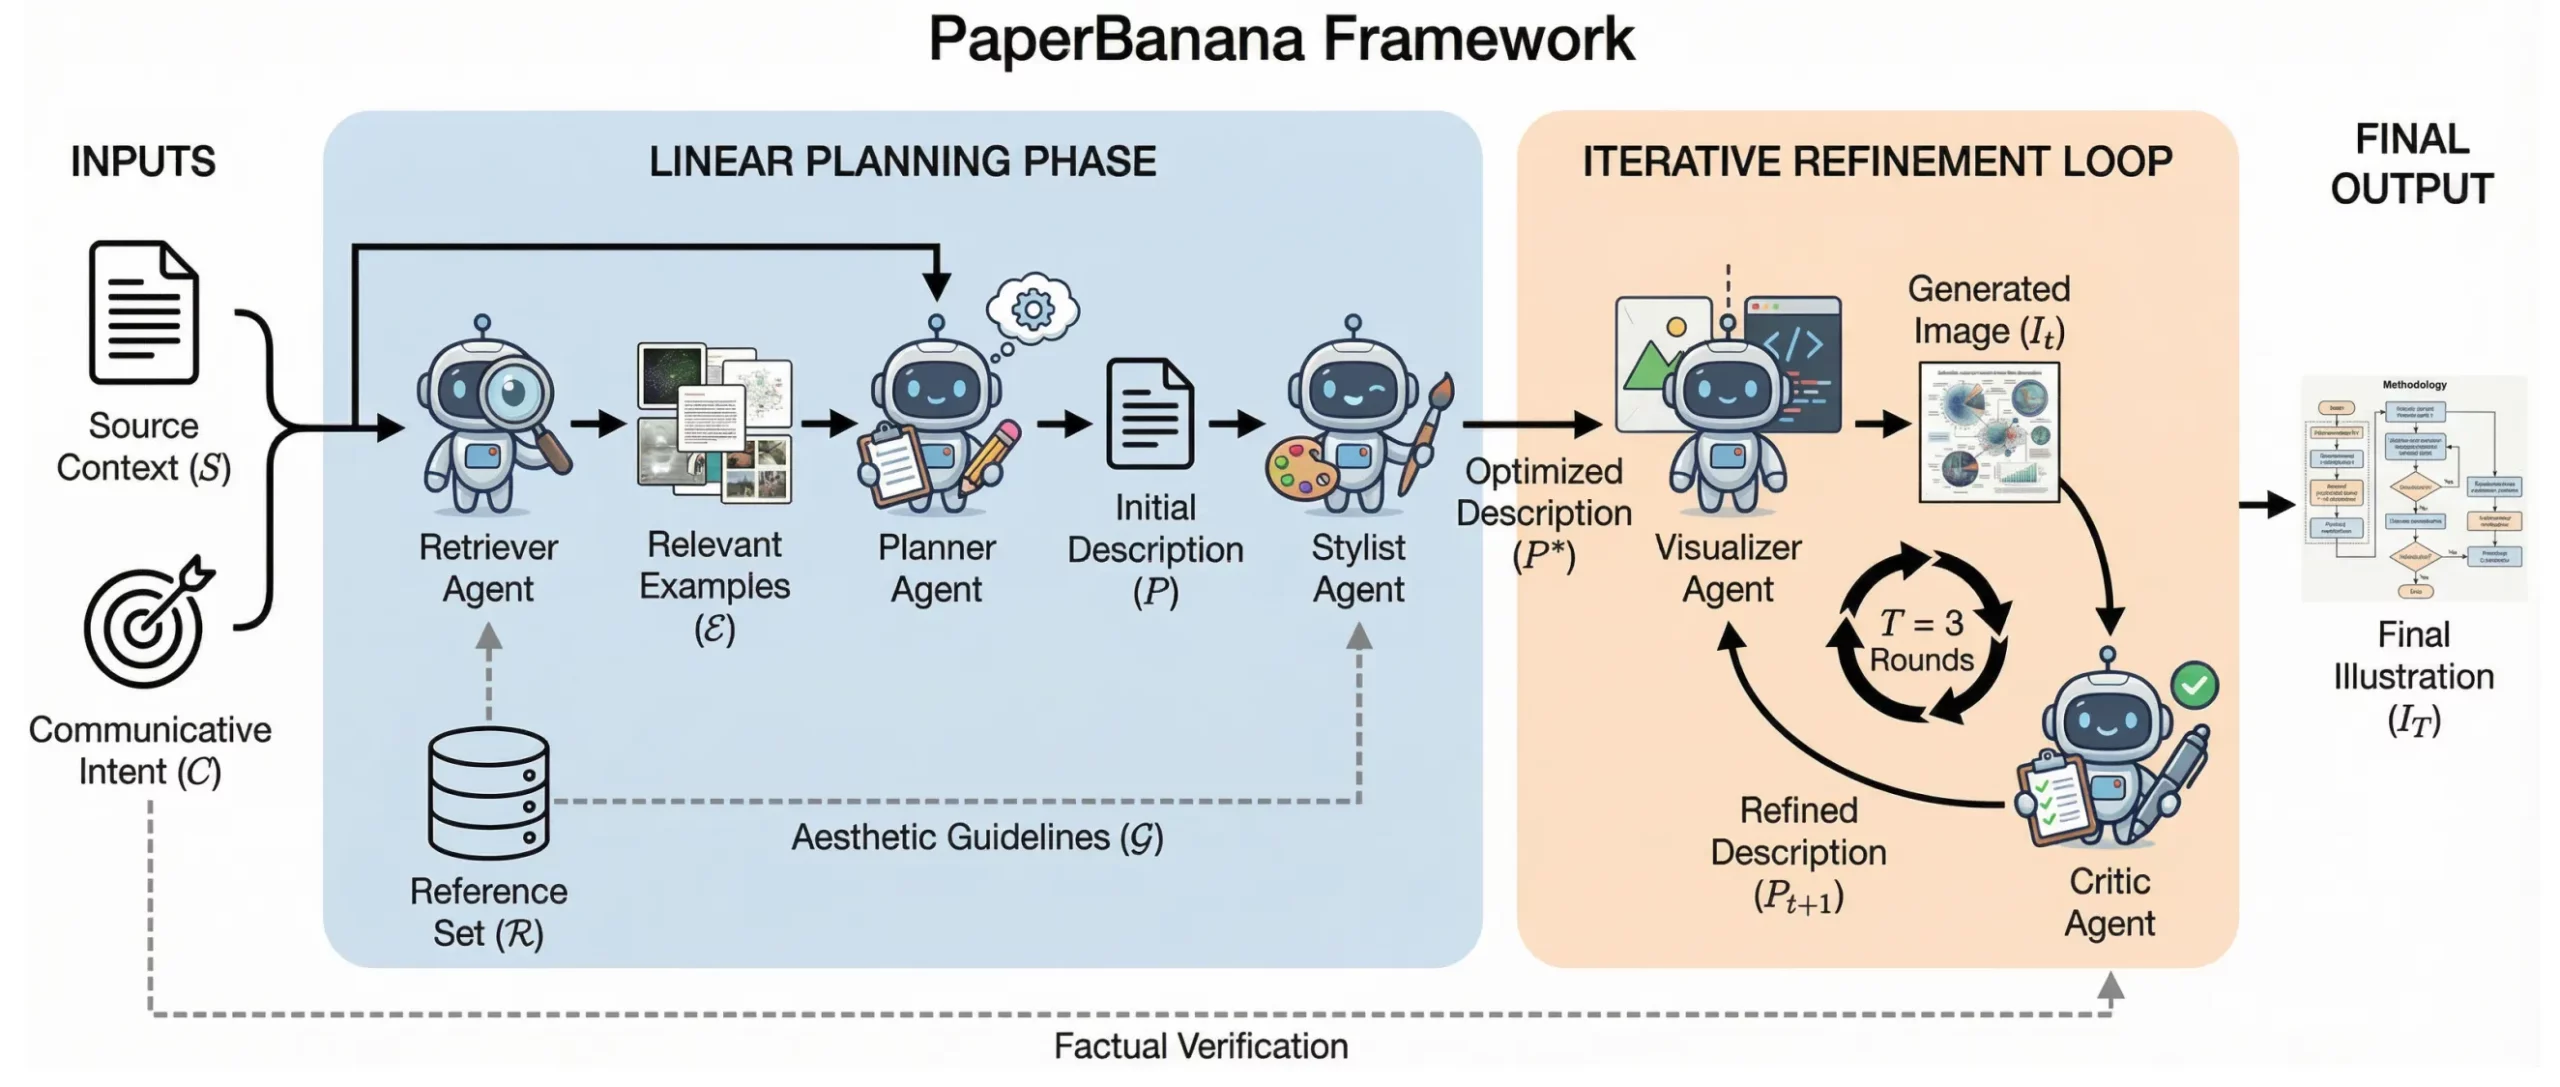
The 5-Agent Creative Pipeline
The system operates through a specialized multi-agent architecture:
- The Retriever: Scans and analyzes diagrams from NeurIPS papers to identify structural patterns and visual "skeletons" of effective academic figures.
- The Planner: Translates the input methodology text into a detailed visual blueprint, determining layout, component relationships, and information hierarchy.
- The Stylist: Extracts color palettes, fonts, line weights, and aesthetic elements from high-quality papers to ensure visual consistency with publication standards.
- The Visualizer + Critic: Generates the initial diagram image, then engages in a three-round refinement cycle where the critic identifies flaws and the visualizer iteratively improves the output.
Key Technical Findings
The research revealed several counterintuitive insights about visual generation for academic contexts:
Random Examples Work Nearly as Well as Matched Ones: The team discovered that showing the model randomly selected examples of good diagrams performed almost as effectively as providing semantically matched examples. This suggests that what matters most is exposing the system to high-quality visual patterns rather than finding perfect topical alignment.
Human Preference Rate: In blind A/B evaluations, human reviewers (presumably researchers or designers familiar with academic standards) preferred PaperBanana's outputs over manually created diagrams in approximately 74% of cases—a "nearly 3 out of 4" preference rate described as "scary" in the announcement.
Statistical Plot Handling: The system can generate statistically accurate plots by using code-based generation methods, ensuring numerical precision while maintaining visual consistency with the rest of the diagram.
How It Works Technically
While the source doesn't provide architectural specifics, the five-agent approach suggests a pipeline where each component specializes in a different aspect of diagram creation:
- Retrieval Phase: The Retriever likely uses embedding-based similarity search across a curated dataset of NeurIPS paper figures, extracting structural templates rather than content.
- Planning Phase: The Planner probably employs a language model to parse methodology text and create a structured representation of visual elements and their relationships.
- Styling Phase: The Stylist appears to operate through aesthetic extraction from reference figures, applying learned design principles rather than simple template copying.
- Generation & Refinement: The Visualizer likely uses a diffusion-based or GAN-based image generation model, while the Critic employs both automated metrics and potentially a reward model trained on human preferences for the three-round refinement cycle.
The system's ability to handle both conceptual diagrams and statistical plots suggests dual generation pathways: one for schematic/illustrative figures and another for data visualization with code-based precision.
Availability and Implications
The announcement doesn't specify release plans, but as a Google research project, PaperBanana could follow several paths: integration into Google's AI offerings (like Vertex AI or Duet AI), publication as an open-source tool, or incorporation into academic writing platforms. The 74% human preference rate suggests immediate practical utility for researchers spending hours on figure creation in tools like Adobe Illustrator, TikZ, or PowerPoint.
For the academic community, PaperBanana represents a significant automation of visual communication—a domain that has remained stubbornly manual despite advances in text and code generation. The quality benchmark (beating human designs 3:1) is particularly notable given the subjective nature of visual design preferences.
gentic.news Analysis
PaperBanana represents Google's continued investment in automating specialized creative workflows, following their previous releases of Imagen for general image generation and Muse for text-to-image synthesis. This development aligns with the broader industry trend of moving beyond general-purpose AI tools toward domain-specific systems that understand professional conventions and constraints.
What makes PaperBanana particularly interesting is its focus on academic visual language—a highly structured domain with established conventions. The finding that random examples work nearly as well as semantically matched ones challenges conventional wisdom in few-shot learning and suggests that visual style transfer in academic contexts may be more about learning compositional patterns than content-specific templates.
This release also continues Google's pattern of using its research papers as demonstration vehicles for the very tools being presented, creating compelling self-referential validation. The 74% human preference rate, if validated through peer review, would represent one of the highest quality benchmarks for AI-generated specialized content, potentially setting a new standard for domain-specific generation tasks.
Compared to existing academic diagram tools like BioRender (for biology) or Lucidchart's academic templates, PaperBanana's fully automated approach from raw text represents a significant leap. However, questions remain about its handling of domain-specific notation in fields like mathematics, circuit design, or chemical structures, which may require specialized training beyond NeurIPS papers.
Frequently Asked Questions
Is PaperBanana available to use yet?
The announcement describes a research project from Google, not a publicly released product. Typically, Google research projects may eventually become integrated into their cloud AI offerings, released as open-source tools, or remain as published research. No public API or release timeline was mentioned in the source material.
What types of diagrams can PaperBanana create?
Based on the description, PaperBanana specializes in academic methodology diagrams—visual representations of experimental setups, model architectures, workflows, and processes described in research papers. It also handles statistical plots using code-based generation for numerical accuracy. The system was trained on NeurIPS papers, suggesting strength in machine learning and AI-related figures, though the principles may generalize to other academic fields.
How does PaperBanana compare to general AI image generators?
Unlike general tools like DALL-E or Midjourney that create images from natural language prompts, PaperBanana is specifically engineered for academic diagram conventions. It understands the structural requirements of publication figures, maintains consistency with academic visual standards, and employs a multi-agent pipeline specialized for this domain. The 74% preference rate over human designs suggests it outperforms general-purpose generators for this specific task.
What was the most surprising finding from the research?
The researchers discovered that showing the model randomly selected examples of good diagrams worked almost as well as providing semantically matched examples. This counterintuitive result suggests that learning the visual "grammar" of effective academic figures—their composition, styling, and layout patterns—matters more than seeing examples of similar content. The system appears to separate visual style from semantic content more effectively than expected.